Jackpocket report shares that digital lottery winners are up 387.1% in the last year, with New Yorkers and Texans spending the most money on lottery play.
Jackpocket today released our Q2 report about the state of digital lottery play in the U.S. In every state where Jackpocket is active, digital lottery play is up anywhere from 29.7% (Minnesota) to 1,084.9% (Ohio). What’s more, total winnings are up 387.1% since Q2 2020 across the states in which Jackpocket is available.
As one of the most-used and well-respected digital lottery platforms, we see the findings of the 10 states in which we are active as representative of the rest of the country.
“We’re excited by the year over year growth in orders we saw in Q2. I believe that this is representative of a nationwide trend around increased lottery play, given the multitude of options and avenues for playing the lottery in 2021,” said Jackpocket CEO Peter Sullivan. “In the states where Jackpocket is offered, we saw an uptick in play in the month of May that began to normalize again in June. However, we foresee greater adoption of digital lottery platforms throughout the rest of this year, especially as Jackpocket expands to new markets nationwide.”
Jackpocket is currently available in Arkansas, Colorado, Minnesota, New Hampshire, New Jersey, New York, Ohio, Oregon, Texas, and Washington DC. The app has plans to expand to other states later this year.
Jackpocket’s data is pulled from the digital lottery play habits of their millions of users over the course of Q2 2021. Here, we have highlighted the most interesting trends from Q2 2021.
Getting Lucky: Number and Game Trends
-
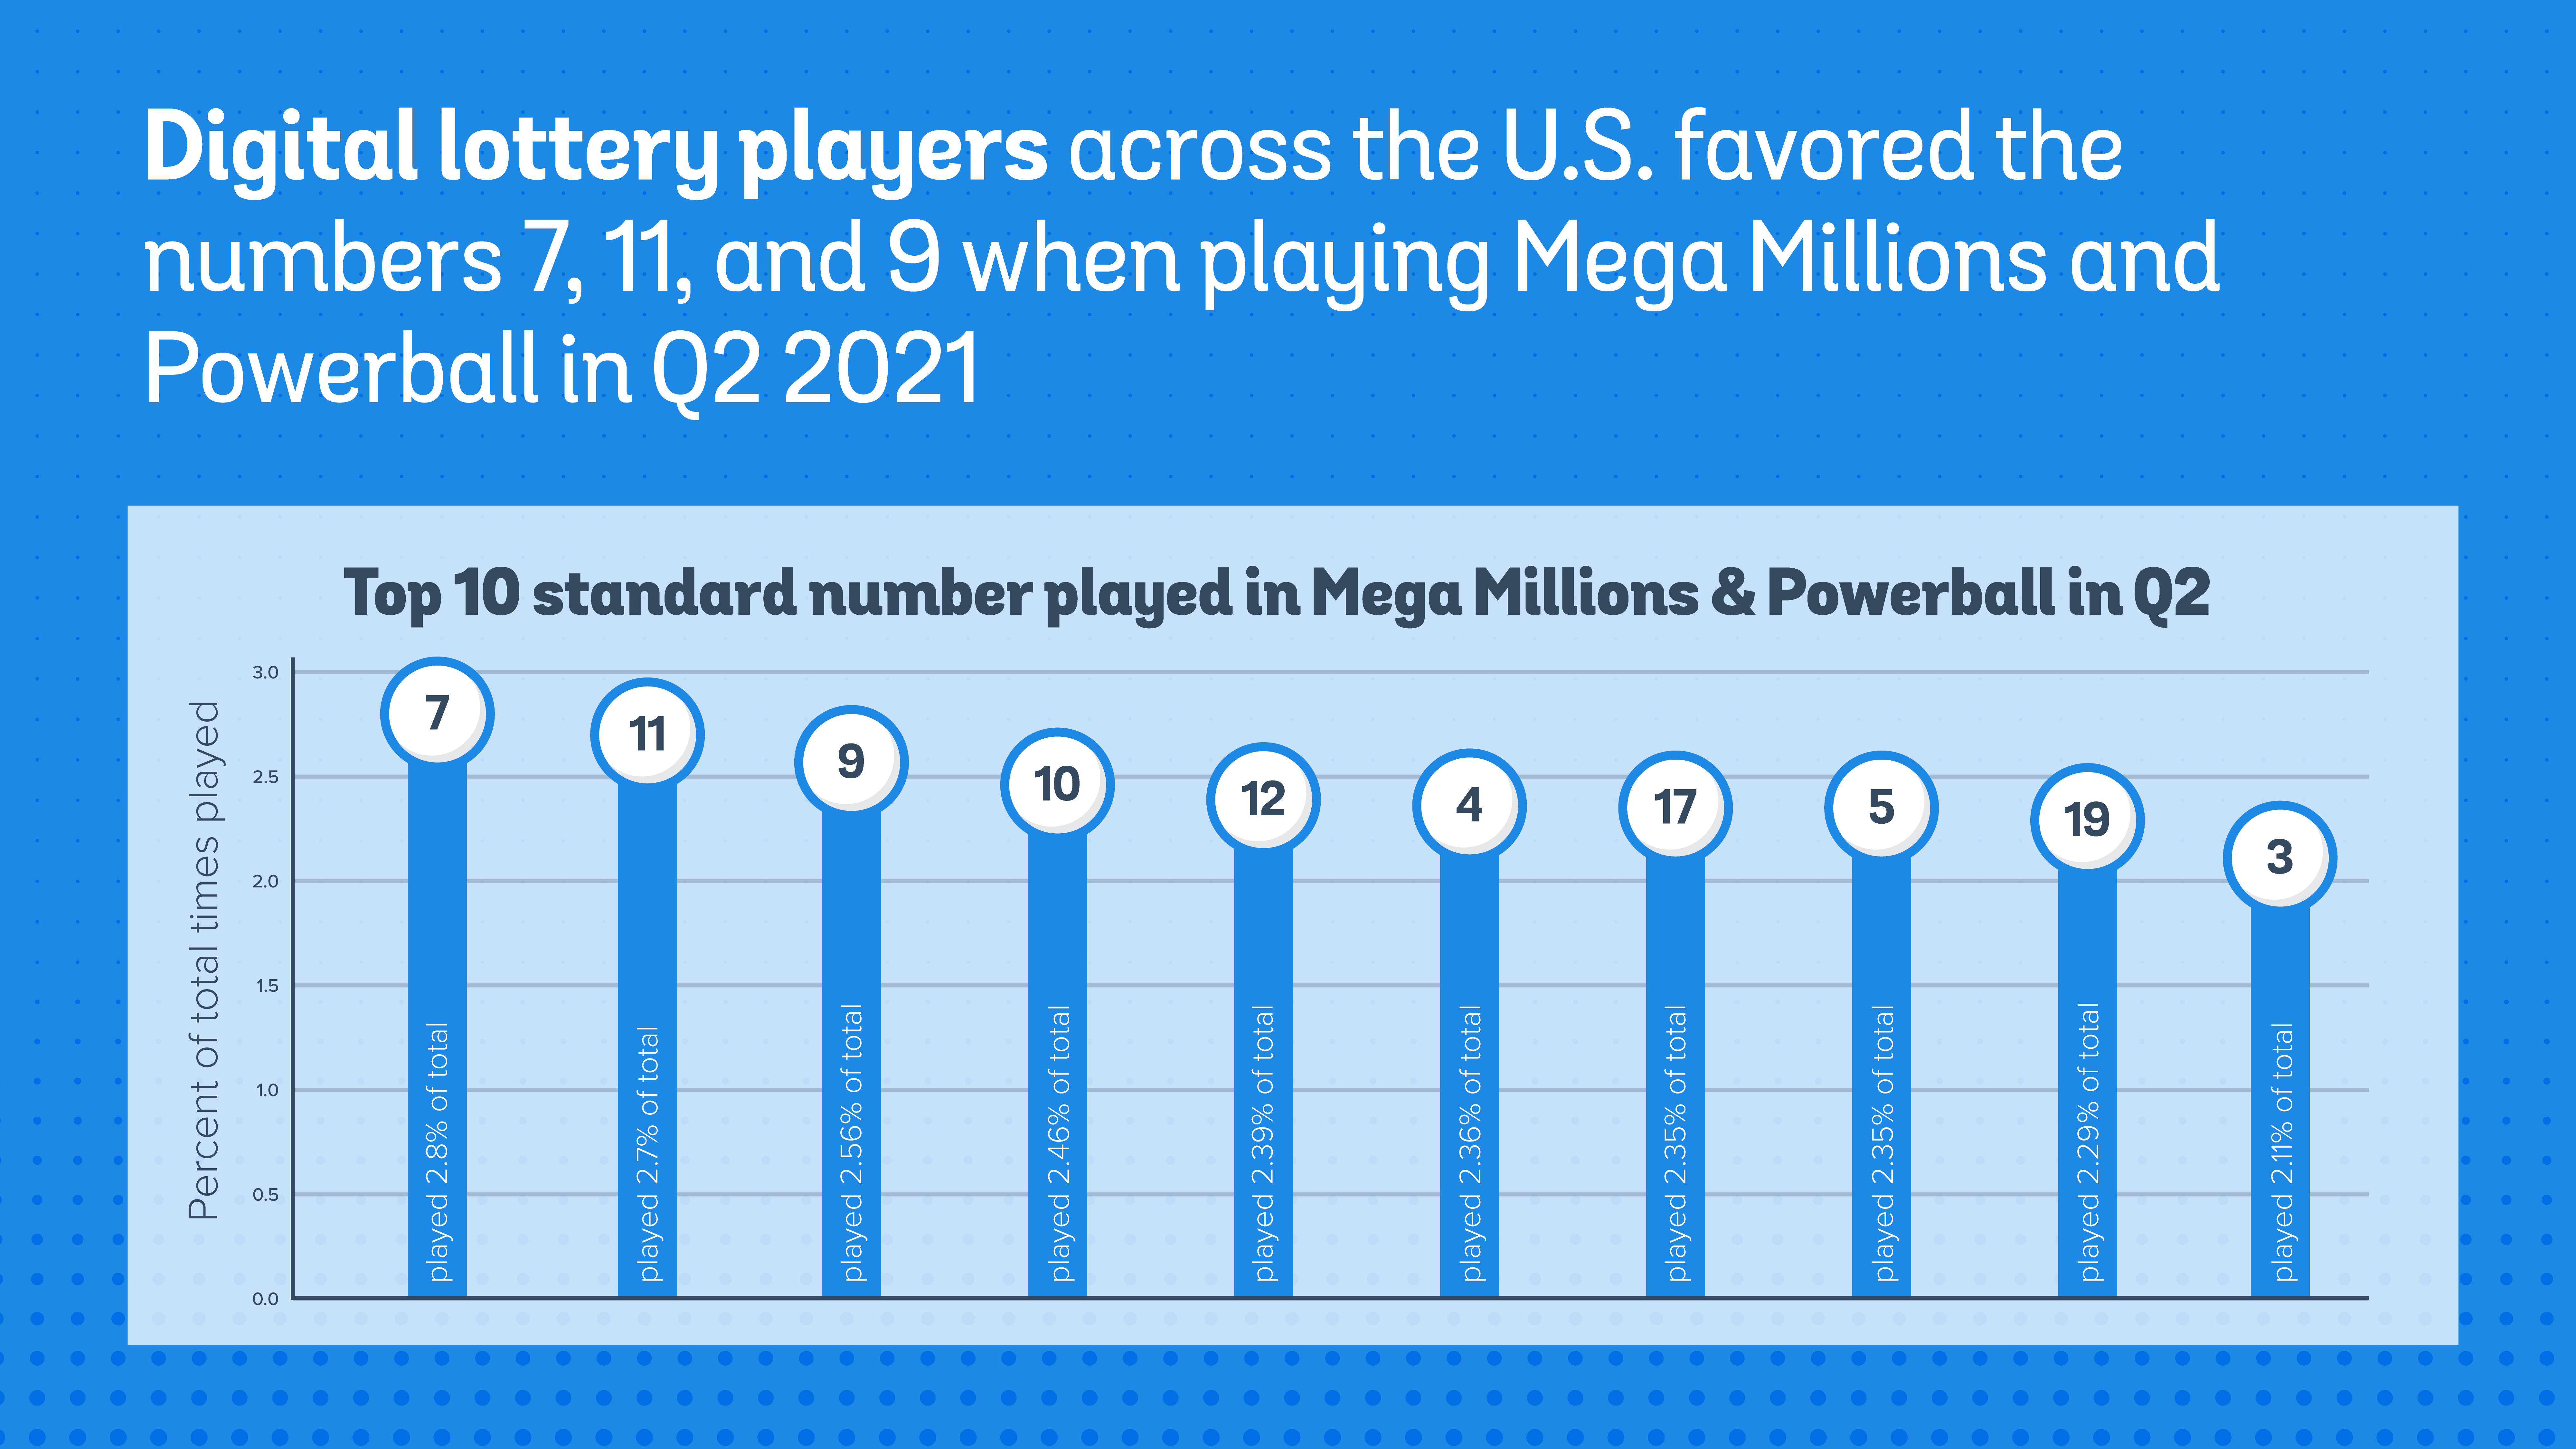
Digital lottery players across the U.S. favored the standard numbers 7, 11, and 10 and the special numbers 13, 7, and 8 when picking their Mega Millions and Powerball numbers in Q2 2021
-
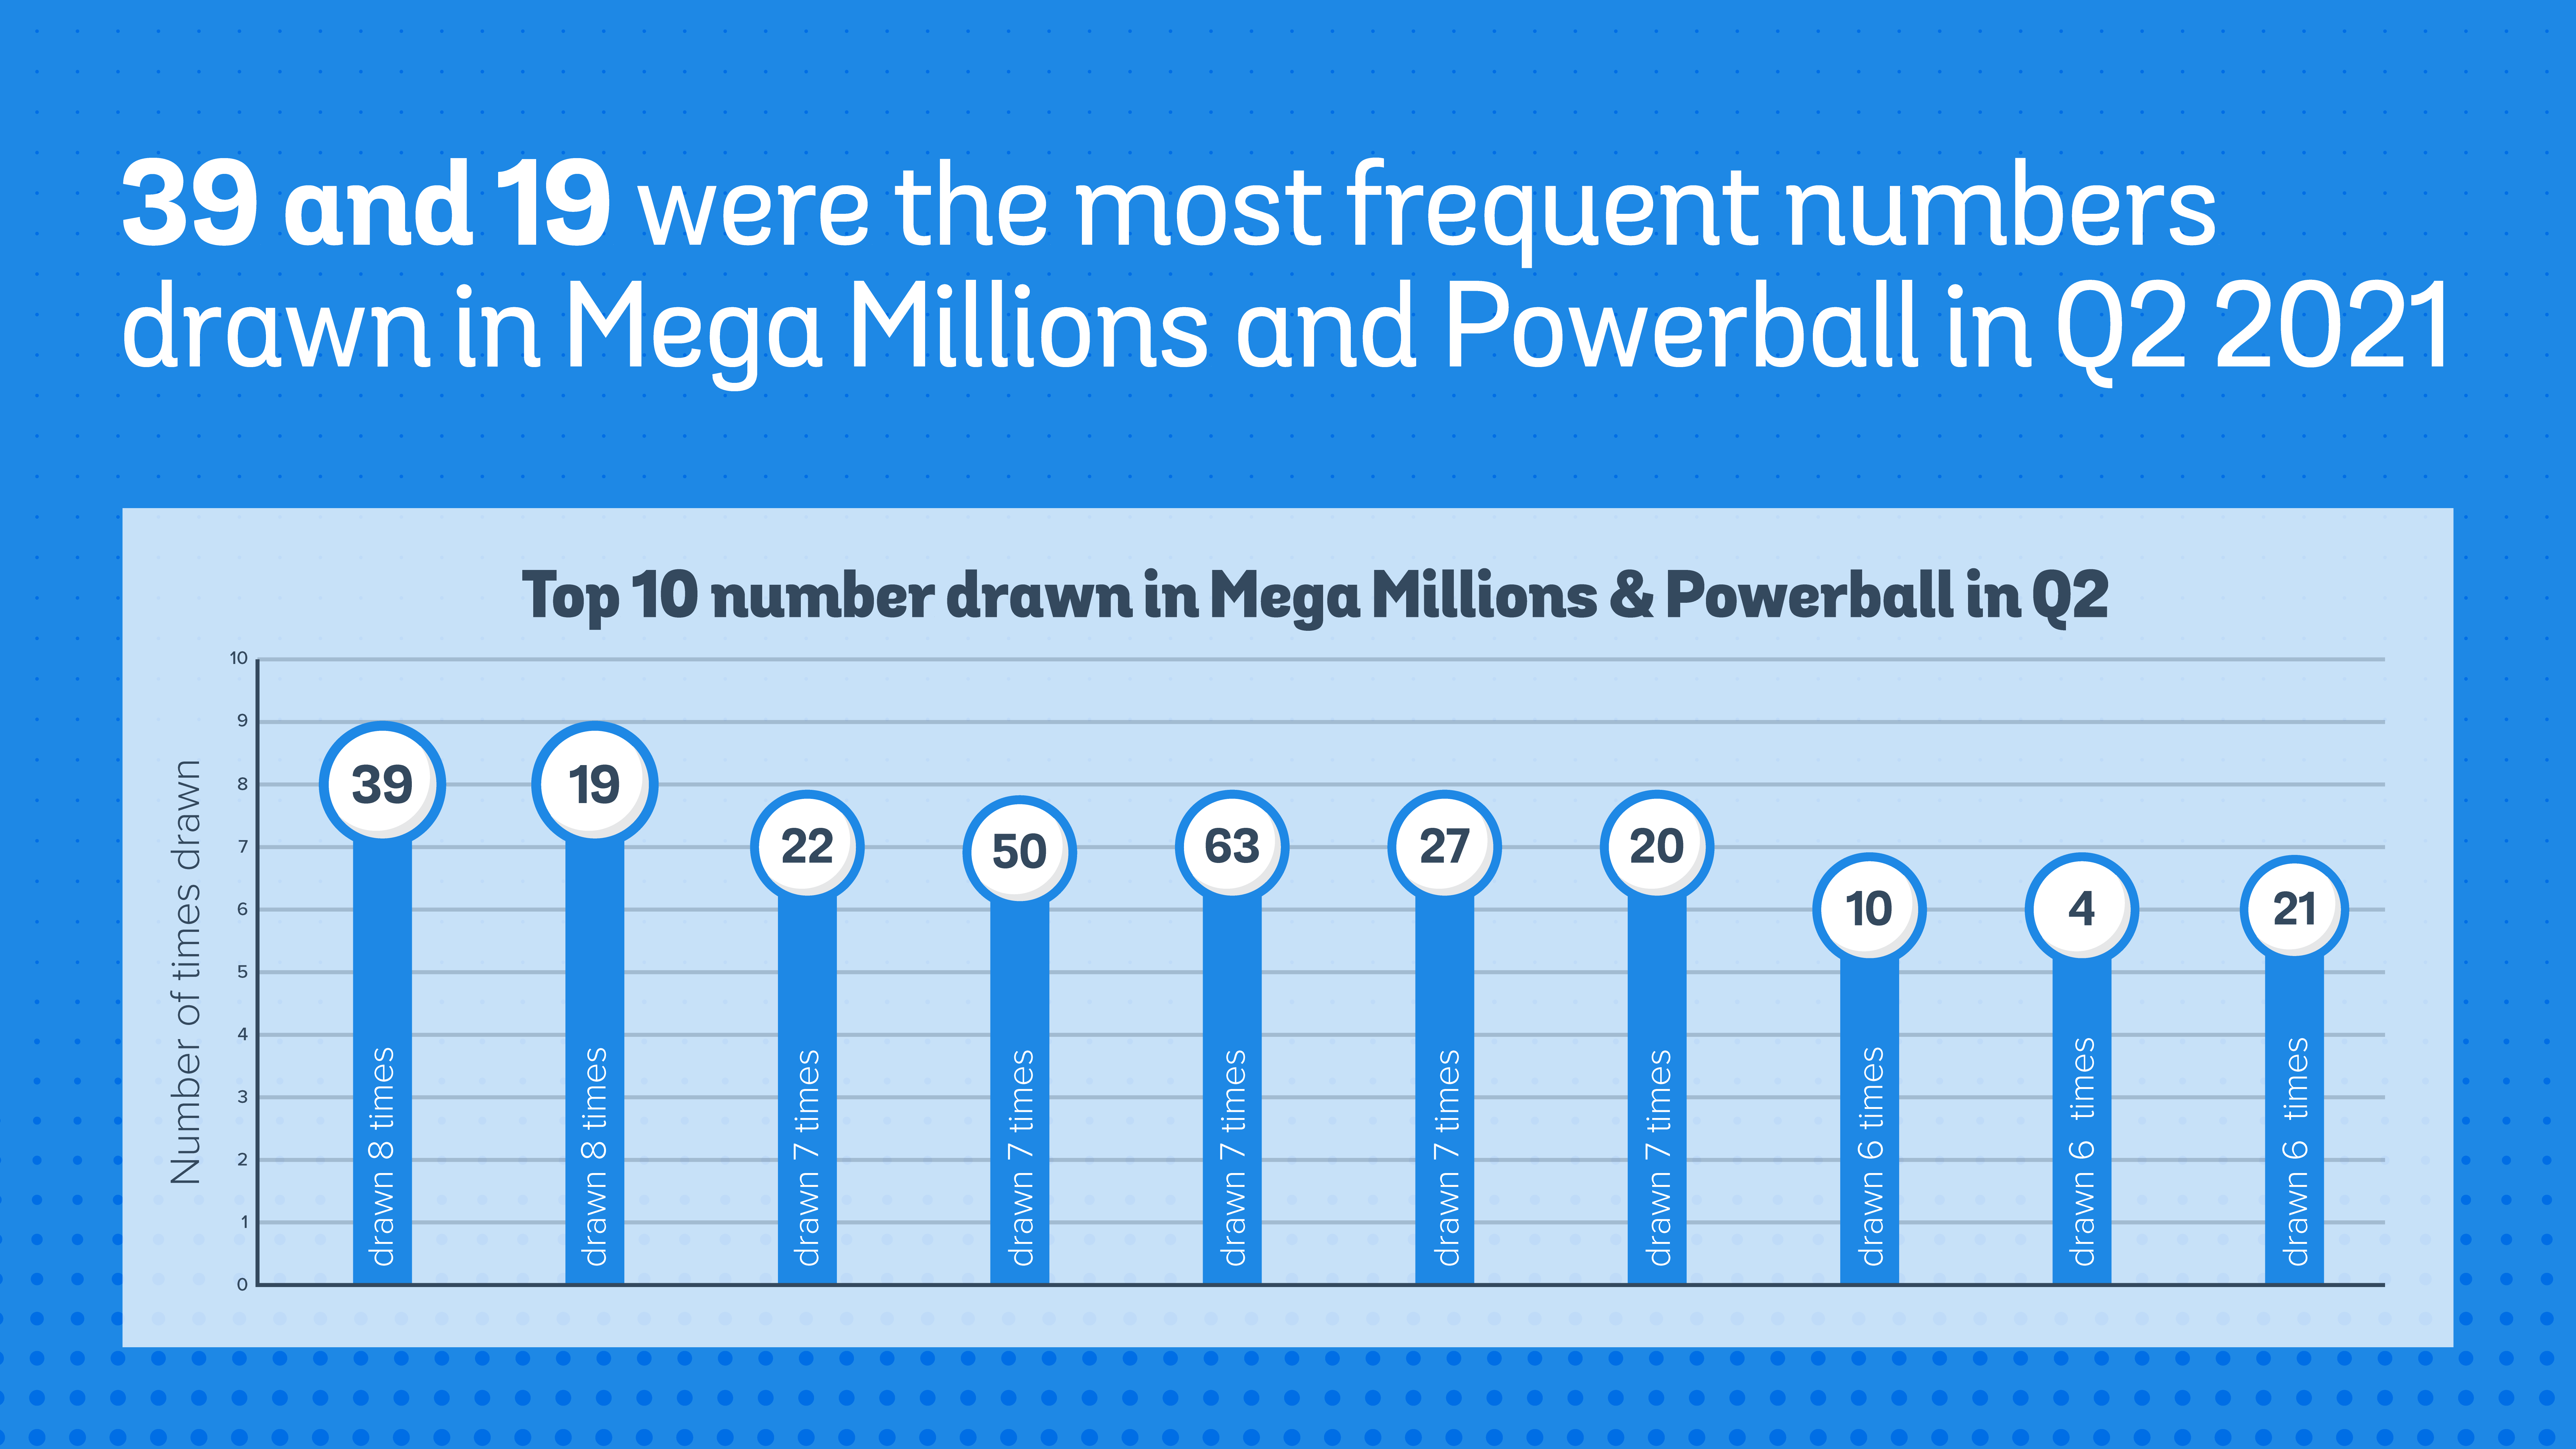
39 and 19 were the most frequent numbers drawn in Mega Millions and Powerball in Q2 2021
-
Specific data findings:
-
Top 10 standard numbers played in Mega Millions & Powerball in Q2
-
7 - played 2.80% of total
-
11 - played 2.70% of total
-
10 - played 2.46% of total
-
9 - played 2.56% of total
-
3 - played 2.11% of total
-
12 - played 2.39% of total
-
4 - played 2.36% of total
-
17 - played 2.35% of total
-
5 - played 2.35% of total
-
19 - played 2.29% of total
-
-
Top 5 bonus numbers played in Mega Millions & Powerball in Q2
-
13 - played 6.12% of total
-
7 - played 5.19% of total
-
8 - played 5.01% of total
-
5 - played 4.82% of total
-
3 - played 4.78% of total
-
-
-
-
Top 10 standard numbers drawn in Mega Millions & Powerball in Q2
-
39 - drawn 8 times
-
19 - drawn 8 times
-
22 - drawn 7 times
-
50 - drawn 7 times
-
63 - drawn 7 times
-
27 - drawn 7 times
-
20 - drawn 7 times
-
10 - drawn 6 times
-
4 - drawn 6 times
-
21 - drawn 6 times
-
-
Top 5 bonus numbers drawn in Mega Millions & Powerball in Q2
-
25 - drawn 6 times
-
8 - drawn 4 times
-
3 - drawn 3 times
-
22 - drawn 3 times
-
19 - drawn 3 times
-
-
-
-
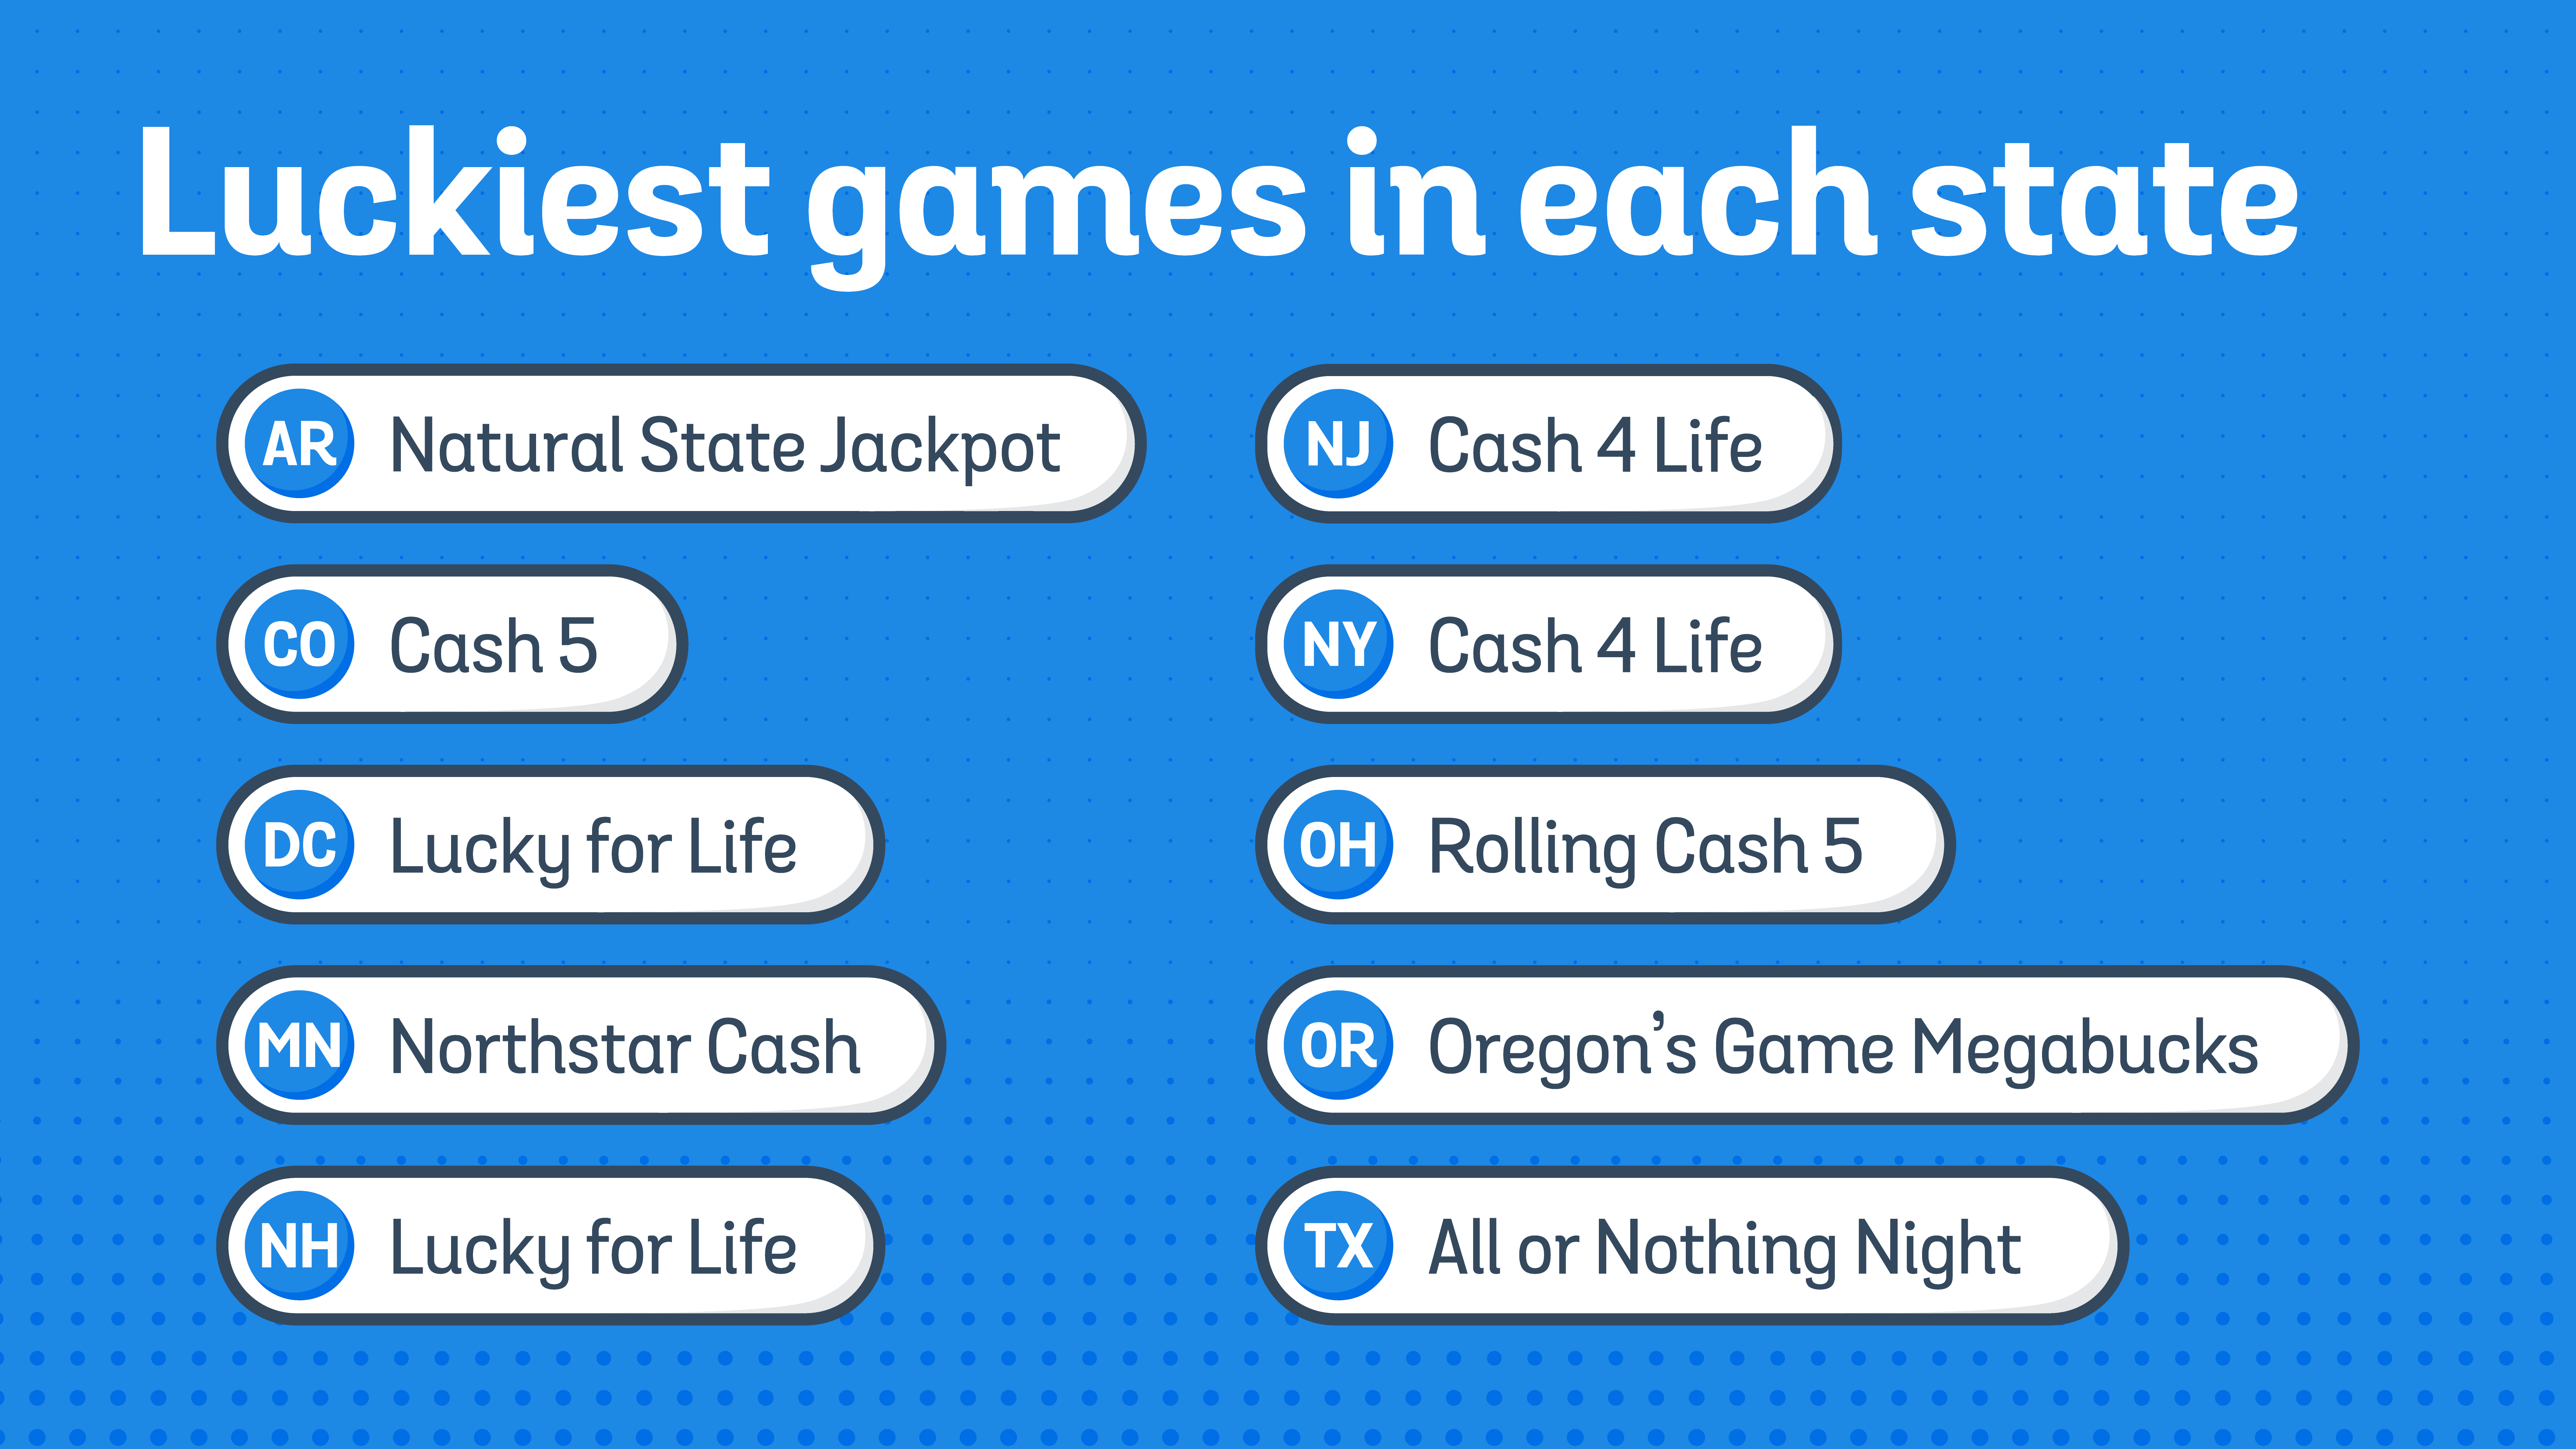
Luckiest games in each state for lottery winners
-
AR: Natural State Jackpot
-
CO: Cash 5
-
DC: Lucky for Life
-
MN: Northstar Cash
-
NH: Lucky for Life
-
NJ: Cash 4 Life
-
NY: Cash 4 Life
-
OH: Rolling Cash 5
-
OR: Oregon’s Game Megabucks
-
TX: All or Nothing Night
-
-
Digital Lottery Demographics
-
Gender
-
Women playing the lottery digitally has decreased since this time last year
-
Q2 2021: 57.8% of total
-
Q2 2020: 64.1% of total
-
-
Men playing the lottery digitally has increased by 6.3% since this time last year
-
Q2 2021: 42.2% of total
-
Q2 2020: 35.9% of total
-
-
-
Age Group
-
Digital lottery is played by:
-
Over 55 (14.5% of total)
-
45-55 (17.8% of total)
-
36-45 (26.0% of total)
-
26-35 (30.6% of total)
-
18-25 (11.2% of total)
-
-
67.8% of players are under 45 years old
-
Players over 55 have increased their digital lottery play since this time last year
-
Top Digital Lottery Stats in Q2
-
Amount spent each month
-
Highest: New York (39.5% of total spent)
-
Lowest: New Hampshire (0.48% of total spent)
-
-
Top Three Winners by State
-
New York ($1M)
-
Colorado ($500K)
-
New Jersey ($466,955)
-
State-Specific Trends
-
Lottery revenue by state is growing YoY in all of the states where Jackpocket is available, with Ohio seeing the greatest amount of growth at 1,166.4%
-
Ohio has also seen the greatest number of growth in ticket orders since this time last year, with a growth rate of 1,084.9%
-
Specific data findings:
-
Lottery revenue by state (Top 3)
-
New York (42.5% of total revenue)
-
Texas (26.7% of total revenue)
-
New Jersey (17.9% of total revenue)
-
-
Other Interesting Findings from Q2 2021
-
Digital lottery players over 55 are preferring to use the mobile web (46.4%) to play Jackpocket, whereas those 26-35 are most frequently using iOS as their preferred digital lottery platform (17.4%)
-
By far, iOS is the top platform used by all Jackpocket players in Q2 2021 (82.6%), but Jackpocket has seen a near 80% growth in adoption of Android since Q2 2020, with 17.1% of players using that platform in Q2 2021
-
This quarter, preference for payment on Jackpocket was as follows:
-
Credit card
-
ACH
-
Apple Pay
-
PayPal
-
Sightline Play+
-
